12.10.3使用SVG图形
在集算器绘图时,也可以选择将图形输出为SVG矢量图,使用SVG图形时,情况和普通的png,jpg和gif图形是有所不同的。
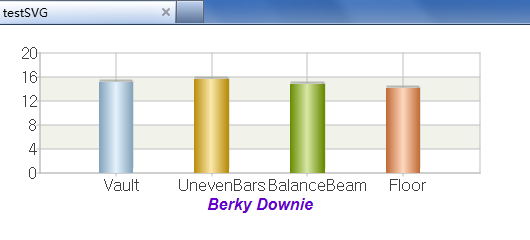
首先,画法有一些区别,先来看看下面的运动员成绩柱图画法ChartSVG.dfx:
|
|
A |
|
1 |
=canvas() |
|
2 |
=demo.query("select * from GYMSCORE where NAME=?",name) |
|
3 |
=A1.plot("BackGround") |
|
4 |
=A1.plot("EnumAxis","name":"x","xEnd":0.9,"xPosition":0.7) |
|
5 |
=A1.plot("NumericAxis","name":"y","location":2,"yStart":0.7) |
|
6 |
=A1.plot("Column","htmlLink":"testChartSVG.jsp?dfx=ChartSVGMain","linkTarget":"_self","axis1":"x","data1":A2.(EVENT),"axis2":"y","data2":A2.(SCORE)) |
|
7 |
=A1.plot("Text","text":name,"x":0.5,"y":-30,"textFont":"Arial","textStyle":3, "textSize":16,"textColor":-10092340) |
|
8 |
return A1.draw(550,200) |
使用的参数name也与第1节中的画法相同,与之相比最主要的区别就是A8中G.draw() 不必添加选项,而且不必另用G.hlink() 返回超链接信息。在这里,超链接改为使用testChartSVG.jsp,代码将在后面说明,而总成绩柱图的画法ChartSVGMain.dfx如下:
|
|
A |
|
1 |
=canvas() |
|
2 |
=demo.query("select * from GYMSCORE") |
|
3 |
=A1.plot("BackGround") |
|
4 |
=A1.plot("EnumAxis","name":"x","xEnd":0.9,"xPosition":0.7) |
|
5 |
=A1.plot("NumericAxis","name":"y","location":2,"yStart":0.7) |
|
6 |
=A1.plot("Column","stackType":2,"htmlLink": A2.("testChartSVG.jsp?dfx=ChartSVG&arg="+NAME),"linkTarget":"_self", "axis1":"x","data1":A2.(NAME+","+EVENT),"axis2":"y","data2":A2.(SCORE)) |
|
7 |
=A1.plot("Text","text":"GYMSCORE","x":0.5,"y":-30,"textFont":"Arial","textStyle":3,"textSize":16,"textColor":-16750900) |
|
8 |
return A1.draw(550,200) |
同样返回SVG类型图片,超链接中也同样使用testChartSVG.jsp。
下面来看testChartSVG.jsp的代码:
<%@page contentType="text/html; charset=gb2312" language="java" import="java.sql.*" errorPage=""%>
<!DOCTYPE html>
<%
String dfx = request.getParameter("dfx");
String arg = request.getParameter("arg");
Connection con = null;
java.sql.PreparedStatement st;
String svg = "";
try {
Class.forName("com.esproc.jdbc.InternalDriver");
con= DriverManager.getConnection("jdbc:esproc:local://");
String callDfx = dfx;
if (arg != null) {
callDfx += "(\""+arg+"\")";
}
else {
callDfx += "()";
}
st =con.prepareCall("call "+callDfx);
st.execute();
ResultSet rs = st.getResultSet();
rs.next();
Object o = rs.getObject(1);
byte[] bytes = (byte[]) rs.getObject(1);
svg = new String(bytes, "UTF-8");
}
catch (Exception e) {
}
finally {
if (con != null) {
try {
con.close();
}
catch (Exception e) {
e.printStackTrace();
}
}
}
%>
<html>
<head>
<meta http-equiv="Content-Type" content="text/html; charset=gb2312">
<title>testSVG</title>
</head>
<body>
<%=svg%>
</body>
</html>
与第1节中的testChart.jsp比较,这里不再需要另用readChart.jsp去处理图片,而是直接用获取的byte数组生成SVG图片的代码,在html中即可直接使用。
SVG代码中,可以包含超链接信息,因此不需要用第2节中的方法另外处理。需要注意的是,SVG的代码需要支持HTML5.0的浏览器才能使用,如IE9以上版本。
此时,如在浏览器中访问地址http://localhost:8080/testChart/testChartSVG.jsp?dfx=ChartSVGMain,结果如下:
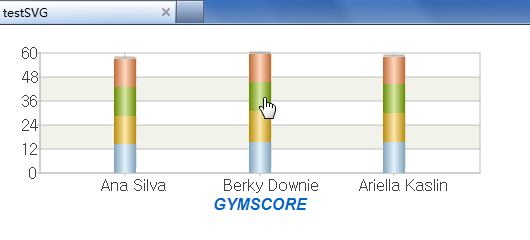
点击即可执行超链接跳转如下: